![]()
BioXing™
Solutions for Biotechnology
![]()
![]()
![]()
![]()
![]()
![]()
![]()
![]()
![]()
![]()
|
BioXing™ Solutions for Biotechnology
|
|
|
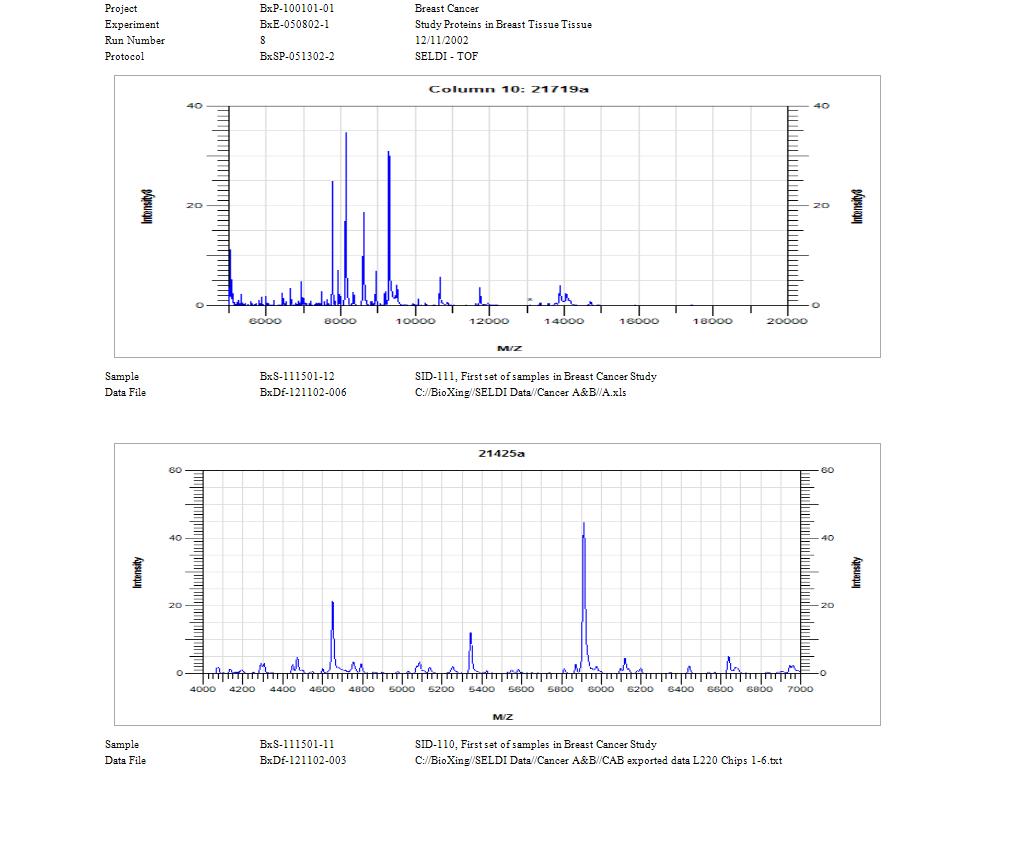
The following is an example of interleaving two tables to create a report. One input table contains annotation data and the other contains graph data. Rows are synchronously rendered from each table. The four-line header and the two-lines below each graph are all from the DataTable containing the annotation data.
|
|
Send mail to
info@BioXing.com with questions, comments or requests for information.
|