| Standard Well Sizes (96-Well, 384-Well, 1536-Well) and custom sizes
are supported. |
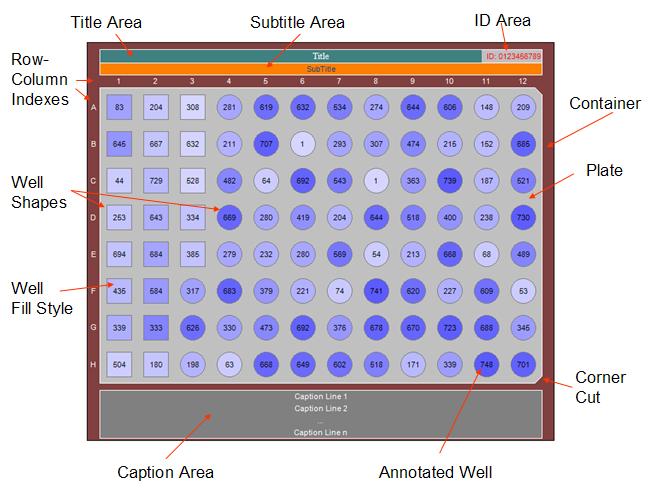
| The control can be any graphical size and can automatically adjust
its size including font size within wells as the window container size
changes |
| Any combination of corner cuts can be specified for matching the graphic
to the type of plate being used. |
| An optional Title area with text alignment. |
| An optional Plate ID area that can be placed on the right or left in the
Title area. |
| An optional Subtitle area with text alignment |
| An optional caption area below the plate can have multiple lines with
text alignment. |
| Font types, colors and styles can be independently set for each area
type. |
| All background and line colors can be independently set for each area
type. The background can also display an image. |
| Wells can display Images and graphs in addition to annotation text |
| Specifying of well replicates and defining of well groups is supported.
|
| Mouse click events for performing tasks based upon the selection of the
well and its replicate and/or group members. |
| Selectable well shapes that can represent different entities, for example, Samples, Standards,
Controls, Targets, Probes, Buffers, Reagents and Fluorescent Tags. |
| Gray Scale and Gradient colors to represent for example intensity or another parameter
values. |
| Wells can be assigned a grouping number so that when selecting a well
the system can highlight all other wells in the group and trigger events
based upon the well and its group members. |
| Well Tooltip content
can be specified. |
| Plate legend of different well types with well shapes can be displayed either horizontally or vertically. |
| Plates can be rotated 90 degrees counter-clockwise and column labeling
can be placed below the plate. |
| Well Magnifier Viewer, both embedded and popup, for displaying one or
more selected wells to facilitate comparisons and viewing more detail. |
| Drag-Dropping of images and data files containing 2D data from a
collection of XY data points in a text file. |
| Dividing plate graphic into multiple regions for emphasis. |
| Copying and printing of plate graphic as it appears on the screen with
all of its annotation. |
| Creating a bitmap of the plate graphic as it appears on the screen with
all of its annotation. |
| Saving plate view to a file in specified image formats (.jpeg, .tiff,
.gif, .bmp, png, .emf, .wmf) |
| Saving and Loading of plate customization property settings to/from an
XML file or stream which is useful for database persistent storage. |
| Save the plate DataTable schema to an XML File. |
| OwnerDraw is available for developers that need/want to do their own
rendering of wells. This is useful when images and/or graphs are to be
displayed. |