![]()
BioXing™
Solutions for Biotechnology
![]()
![]()
![]()
![]()
![]()
![]()
![]()
![]()
|
BioXing™ Solutions for Biotechnology
|
|
|
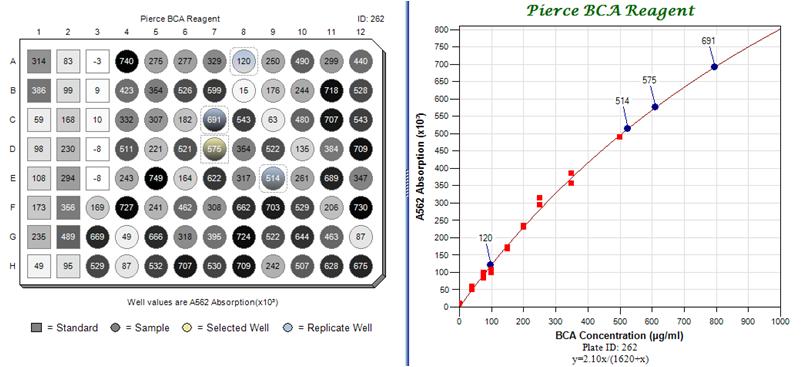
This section contains a number of images showing examples of different plate views and component features. These examples, with more detailed descriptions are contained in the downloadable Views document. The following image is taken from a Standard Curve application being developed by BioXing. The plate provides a summary view of the data as well as an interactive graphic linked to a graph and to a data table (not shown). On the left the microtitre plate contains 21 standard wells from A1 to E3 represented by square wells and samples represented by circles in the remaining wells. The gray scale colors of the wells reflect the magnitude of absorption and the annotation numbers within the wells provide the magnitude. The square-cornered dashed-line rectangle at D7 with a yellow gradient indicates that it was the primary selected well and the three rounded-corner dashed-line rectangles with blue gradients at A8, C7 and E9 indicate that these samples are replicates of the sample at D7. In the graph at the right, the red squares represent the standard data used to calculate the standard curve and the annotated blue dots represent the corresponding selected wells in the plate. Options were set so that when a well is selected, the plate and graph are automatically updated with its annotated location and with any replicate samples.
This view shows a plate containing plant images within wells which shows the state of the plant from where the well sample was taken. The component has an option for creating and showing an embedded and a popup magnifier viewer. As the mouse is moved over a well, its current display content is automatically magnified in the viewer and selecting one or more wells will cause them to be displayed within the viewer for more detailed comparison.
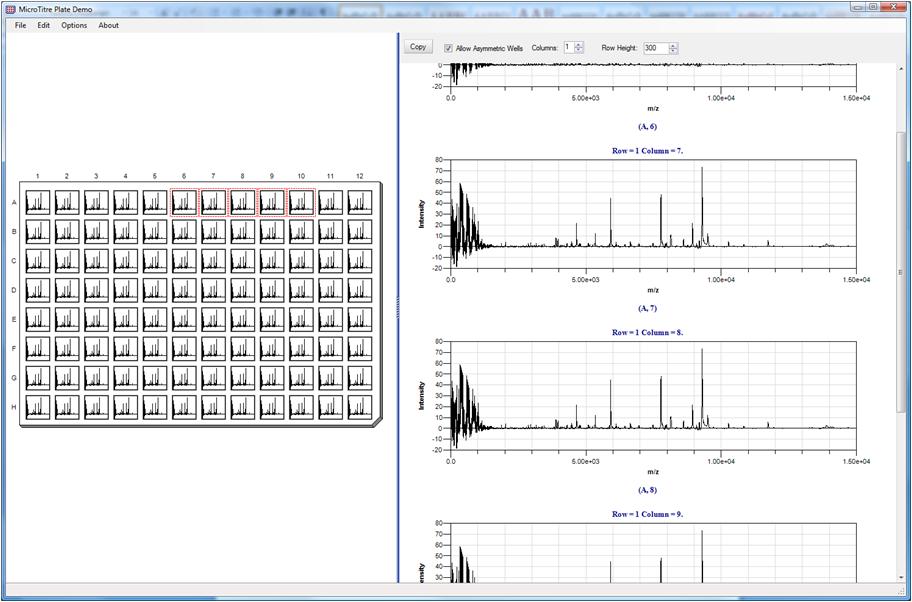
This view shows displaying of graphs within wells and the collection of wells from A6 to A10 were selected and are displayed within the embedded magnifier viewer. The option 'Allow Asymmetric Wells' is checked which relaxes the restriction that width must equal height and is more suitable for comparing collections of graphs. In this view the demo program created 96 instances of the same graph data for illustrative purposes, but all wells can contain different data.
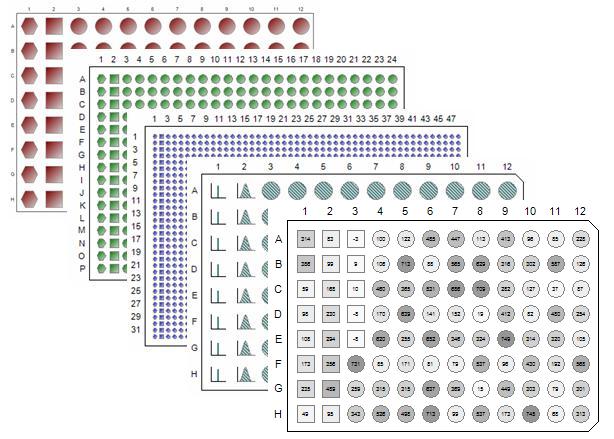
The following figure shows a cascade of different plate sizes with different shapes and annotation.
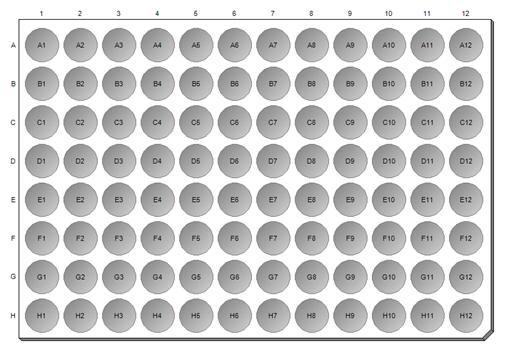
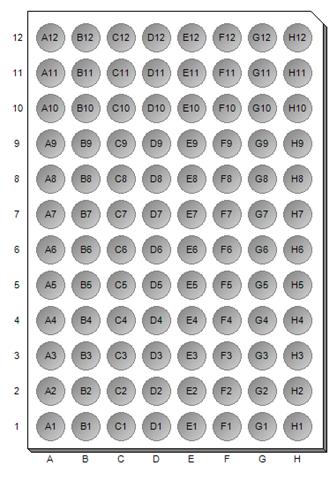
The following figure shows a 96-Well microtitre plate view with three different well shapes that could represent Standards, Controls and Samples. It also shows wells that are empty using a cross-hatch pattern and wells that are marked excluded with red X’s. Filled wells have a gray-scale pattern showing magnitude and the well interior annotation displays a ratio of a measured magnitude to a maximum value. The plate shape has a Bottom-Right corner cut.
The plate can be easily rotated counter-clockwise 90 degrees as illustrated in the following two figures. The figure on the left is the default orientation while the figure in on the right is rotated and in addition, by setting an option, has its column labeling below the plate.
Since the corner cuts are also selectable and optional,
shapes of wells customizable and row-column size is definable, the component can
be used in an interactive
|
|
Send mail to
info@BioXing.com with questions, comments or requests for information.
|

 interface
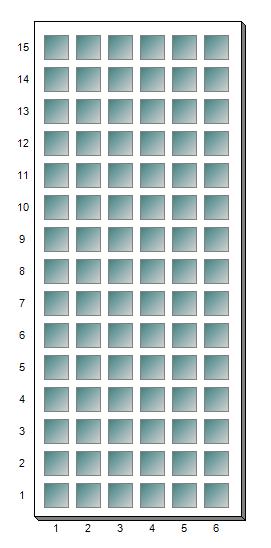
for rectangular fraction collectors such as illustrated in the following figure.
interface
for rectangular fraction collectors such as illustrated in the following figure.